AI going to replace 50% of human jobs according to a new CNBC article quoting Kai-Fu Lee, founder of venture capital firm Sinovation Ventures and former head of Google China. Peter Norvig, current Director of AI at Google has also commented on his concerns around AI decimating the job market recently. I think about these topics often as I am the founder of HiringSolved, an AI based software company which makes recruiting more efficient. So, when will AI come to take your job away and what can you do about it?
Don’t panic! This is our destiny. Building Artificial Intelligence to take away our jobs is a very natural part of the evolution of the human race. Humans are unique because we can create and use tools. The tools we create enable us to work more efficiently, which means that it requires less people to do the job with tools than it did without them. Therefore, the technology we create does some of the work for us, eventually replacing us and taking our jobs.
This isn’t a new thing. Consider the humble wheelbarrow, a 2000 year old technology which enables 1 person to carry the same amount of weight as 10 people. In making the task of carrying things easier and more efficient, the wheelbarrow is an example of technology taking away jobs. For a more recent example, take a look at the computer itself. Most people don’t know that the word “computer” was actually a job title before it was a type of machine. The word “computer” used to be the title of a human worker who made calculations manually. Machines took that job from us so quickly that most people don’t even realize that we used to be the computers. However, I would argue that nobody wants to give up their spam filter or start doing long division by hand and give up Excel.
OK, we have established that we as a species are special because we make technology, that it eventually takes our jobs and that this has been happening for a very long time. Even the AI programmers themselves are not safe. DARPA, the good people who brought us the Internet are working to automate some of what ML/AI engineers do. So, when will technology take your job? Let’s break this question down into a few hypothetical scenarios:
Read More…
About The Author

Shon Burton is the founder and CEO of HiringSolved, which builds AI based recruiting software like RAI. Mr. Burton is also the co-founder of MLconf, a leading independent conference on Machine Learning and The Artificial Intelligence Conference which is hosting an AI Startup Competition with Spark Capital for new companies applying AI in new products. If AI does take all of our jobs it will be partially his fault. As a concession, Shon would like to offer the reader a 20% discount code to The AI Conference in June in San Francisco.
Guest Blog Post: "Yes, Virginia, You Can Address Causality in Your Dataset: Alex Dimakis on Causality"
MLconf SF 2016 saw many wonderful speakers that took us on a tour of the many business sensitive aspects of modeling Big Data: choosing the right problem to solve, how it’s not always about deep learning; logistic regression, SVMs, and gradient boosting still have a heavy hand to play in solving problems and deriving insights; and how many of the best business solutions require different approaches for different aspects of a problem. Causality of factors in a model is an elusive quality that speaks to many business goals and the core reasons for starting a query, solving a problem, creating a model. Alex Dimakis, at the most recent MLconf in San Francisco, outlined for us one computational framework for ascertaining causality.
What is Causal Inference?
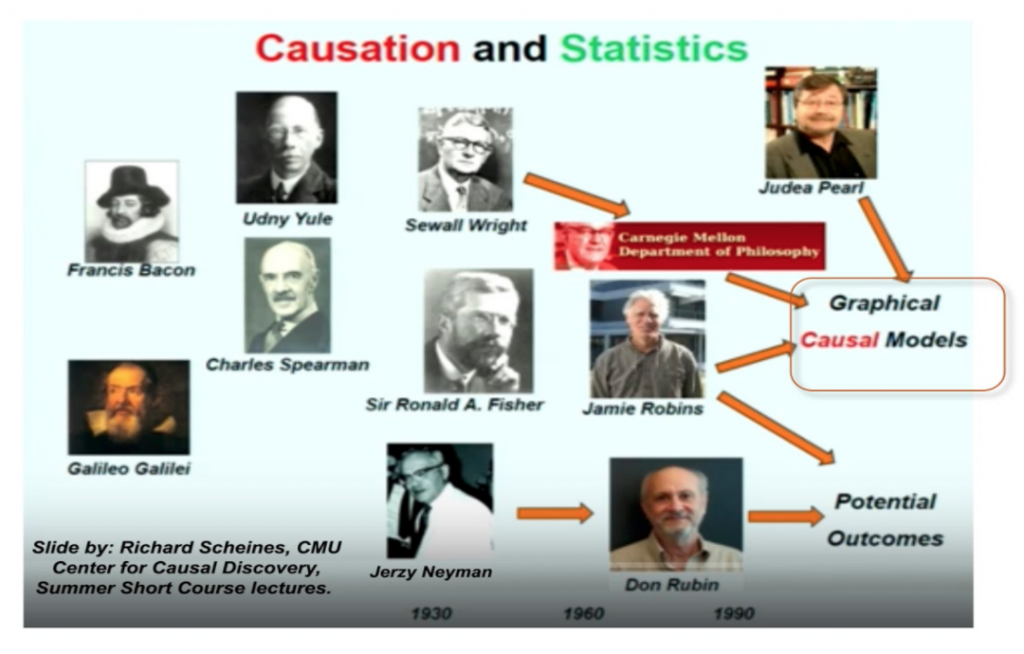
There are many frameworks for investigating causality including philosophical, statistical, & machine learning ones. To name a few of the most popular frameworks, these include Granger causality (used widely in Neuroscience and Economics), Hume’s counterfactuals framework, and Pearl’s structural equation causality (which grew out of Fisher & Wright’s genetic heredity work) that utilizes graphical causality to represent our understanding of causality. The various frameworks for understanding causality can partly be understood as a product of the fact that causality is complex, sometimes evidence for a cause is different across contexts, and the fact that some causes are not deterministic, while others are probabilistic.
Statistically, causation has a history with interpretability of models and model construction. Causal interest in models related to the mechanism, or understanding how the mechanism relates to the phenomenon under study. This requires defining what we mean by mechanism and understanding what we know and how we know it in order to ascertain whether two observations are related/not related causally.
In statistical causality, we try to address the question of whether or not there is a dependency between two variables. Correlations are usually the first blunt tool used to asses whether or not two variables are related and many would argue that with sufficient amounts of data, causation isn’t necessary because vast amounts of data (petabytes, etc) increase reliability of correlations while drowning out noise. So, why would we care about ascertaining causality when we have so much data?
One motivation for causal analyses is that while correlations show how two variables increase or decrease together, sometimes that is all two variables are: two time-series with similar trends. In decision-making, we do not want to rely on two things that correlate by chance or have similar trends but are causally unrelated. A recent example of this sort of effect is Google’s searches /Flu tracker keeping pace with Center for Disease Control (CDC) estimates of flu incidence. Flu incidence and searches related to flu in the Google correlated and seemed to predict one another until they didn’t. There could be many reasons for this: searches being magnified by friends, neighbors, and relatives looking for information related to someone’s flu (but not their own) or the impact of news about the flu on search queries. We know that the Google search predictor of flu incidence is not causal, and it was useful for a time (not all predictors need to be causal in order to be useful), but in an ideal world we would understand the causal factors in order to make decisions.
In assessing independence of observations, we ordinarily consider two uncorrelated variables to be independent from each other (orthogonal). This assumption holds when the observations are Gaussian (continuous measured variables). This doesn’t work for categorical or event-based observations such as “having a cancer diagnosis”, “buying a coat”, “starting a war.” With these variables, you must consider the joint probability of the two observations co-occurring. In a rank one contingency table, one compares the observed rate at which the two variables are observed together against marginalized independently generated data. To check for independency, one checks to see if the matrix is well characterized by the product of the scalars generated randomly/independently. If the contingency table approximates the independently generated data, the variables are independent. If not, the events/variables may have a dependent relationship that ought to be explored.
Exploiting Conditional Dependency Graphs in order to infer causality: Interventions
Alex Dimakis introduces Pearl’s structural equation framework for causal reasoning by introducing directed graphs first. Directed graphs can be used to represent conditional dependencies. For example, A-> B -> C, would represent variables A and C that have a relationship to each other conditioned on B. This is A and C are related to each other, but mediated or partially affected by variable B. Learning a directed graphical model is a first step to learning the causal relationships amongst variables. With enough data, one can learn all of the conditional independencies in the graph. Then, we can query the graph about directions of effects. For Pearl, the central question is about the direction of effects: did A cause B or did B cause A, or are these two variables not related to each other? However, we know that joint probability distributions on two random variables can be factorized in both ways and can be true in both the world that A causes B and when B causes A. So joint probability distributions are not enough. Therefore, we need an instrumental variable to intervene. An intervention can be a control group, or a known precondition, or a temporal factor that appears or is forced upon the observations before the event. In this case, if the observations are truly independent, your intervention cases will not differ from the other cases in event incidence because they are both randomly assigned. If you observe a difference, then you have a causal relationship between your two variables because they do not co-occur randomly.
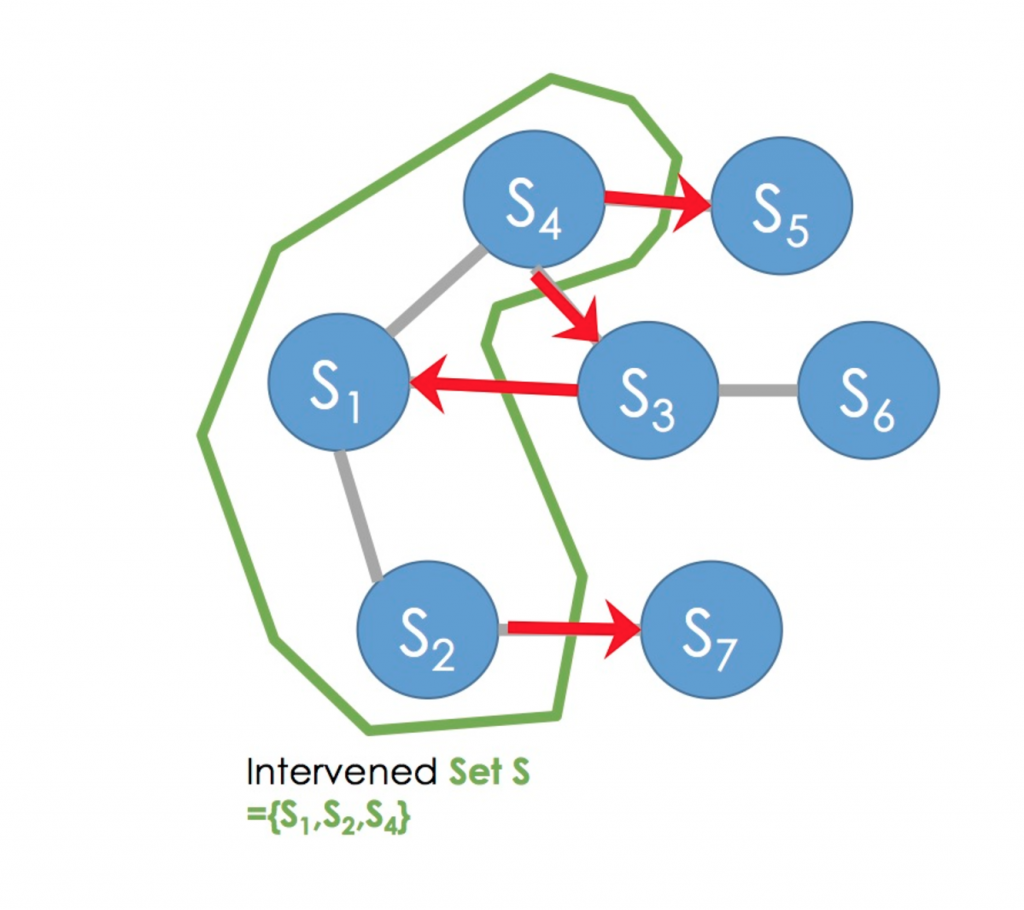
One way to learn causal relationships of variables in a complex directed graph (Skeleton Graph) is to intervene on a set of variables (see graph representation). By intervening on a set of variables, one learns the directions of relationships between those variables intervened on and the edges of those variables connected that were not intervened on. After learning causal directions, one can design another intervention to learn more directions of the graph. There are two ways to proceed after this: either deciding a priori which order the interventions will be done, or deciding the order of interventions on the graph adaptively depending on the outcome of previous interventions (or a version of adaptive interventions by designing randomized adaptive interventions). This is an active area of research, including work done in Alex’s group, where the efficiency of learning causal directions of graphs is measured. Some groups have found that fixed interventions are enough to learn all you can from the Skeleton Graph about causal directions and adaptive interventions do not add more information, but there is some evidence to suggest that highly randomized adaptive interventions do result in better information. This is an active area of research.
The slides of Alex’s talk are available here and you can watch his full talk here. Dimakis recommends a course by Richard Scheines available online free of charge, here. If you are interested in learning more about this topic, Samantha Kleinberg, who spoke at MLconf NYC this year, has a book on the subject “Why: A Guide to Finding and Using Causes” and a video talk available here. MLconf has a code you can use to get this book with O’Reilly.

About the blogger: Ana Maria Fernandez is a PhD Candidate, Clinical and Molecular Medicine, at University of Edinburgh and an active member of the MLconf community.
Guest Blog Post: "Why I Hate Chatbots"
Our Co-Founder and the CEO at HiringSolved, Shon Burton, recently shared his musings on bots and what his team has been working on to streamline the recruiting process..
The last chatbot I wrote was called “Larry”. It was written in 1999 to simulate a conversation with my boss at the time, Larry Rocha. “Larry’s” main function was called RochaBrain() and it contained conditional triggers and responses which allowed my workmates, including Larry himself to enjoy a good laugh while interacting with it. It was just believable enough to be pretty funny for a minute or two, albeit in a limited context.
So why the sudden hate for chatbots? Let me explain. As a kid growing up in the 80’s, I was fascinated with AI. I’ve collected and modified different versions Eliza, Racter, Alice and more. Computer programs that could hold a human-like conversation were not only fun to play with, they were and still are regarded as one of the primary indicators of artificial intelligence and even consciousness. The famous Turing test, a thought experiment postulated by the great Alan Turing over 60 years ago, is still referenced today as a primary measuring tool and metric for artificial intelligence.
If Turing himself were alive today, he may have different ideas about how to define and measure artificial intelligence. The concepts of “thought”, “intelligence” and “consciousness” are entirely philosophical in nature in that they defy rigorous scientific definition. These ideas are entertaining to ponder but not very practical. Chatbots in my view, are similar; entertaining but not practical. The high-water mark of a Turing Test certified chatbot, is a casual conversation in which the software’s responses are indistinguishable from a human. I think that we can do better.
AI needs to be better than a human. More useful. More like Alexa and Siri on steroids, rather than HAL or C3PO. Shifty, insecure and homicidal, HAL was far too human. Even Tony Stark’s J.A.R.V.I.S is too human. Too opinionated, too chatty. Data from STTNG is also too human for some of the same reasons. On the topic of Star Trek, the computer intelligence powering the Enterprise D strikes the right balance. It communicates very well but it doesn’t exhibit any of the human eccentricities or flaws which would impede its usefulness.
So what is a better AI and how do we build it? Useful AI is an exercise in UX Design. The main advantage that artificial intelligence has over human intelligence is it’s ability to quickly access and process massive amounts of information. Combine this ability with a human level understanding of language and you have something interesting: A conversational interface to knowledge and computation. Human creativity will still be required but it will be greatly magnified with this new tool.
We’re experimenting with a tool like this at HiringSolved. We call it RAI. We think of it as Siri for recruiting. RAI is a closed domain tool working on a retrieval based model with access to HiringSolved’s massive index of talent data. RAI is not ground-breaking from a Turing Test perspective. It won’t fool anyone into thinking it’s human, but for practical recruiting tasks it’s already quite useful. By combining the practical conversational interface of tools like Siri and Alexa, with a Wolfram Alpha inspired ‘knowledge engine’, we’ve developed a recruiting assistant with which a non-expert user can conduct a talent search conversationally.
Current systems require the user to construct searches using keywords and boolean operators. RAI simply allows the user to say: “I need to find female javascript developers with reactjs experience within 25 miles of Austin, Texas” and RAI produces results. From there, RAI can help the user construct and send a message to the selected candidates. This isn’t going to replace a human recruiter but it does reduce the number of steps involved in recruiting, letting the recruiters be more personal in their approach. If you would like to experiment with RAI sign up here. We’re releasing user accounts in small batches next month.

Shon Burton is CEO and Founder of HiringSolved, a market leading HR Tech startup focusing on the talent acquisition and talent search market. Prior to HiringSolved, Shon founded MLconf along with Courtney Burton. In his spare time Shon enjoys long walks on the beach with Courtney, playing Legos with his daughter and and spending hours restoring ancient, obtuse computers.
This Week in Data by Braxton Mckee (CEO, Ufora) & MLconf Alumni Speaker, Issue #9
Kick Off
Every day, data models run by various companies are putting you into various categories. Rarely do you get to see their findings on you. So, it’s kind of cool that there’s a way to get inside Facebook’s data model. People are paying attention to this because of the media firestorm over how Facebook’s news feed algorithm seems to be biased against conservative political news. You can go to facebook.com/ads/preferences and see exactly what the social media company thinks about you. (Full explainer here.) As more companies integrate data models into their businesses, I expect we will see broader push – perhaps, legislation even – requiring this sort of transparency.
We also continue to see Facebook dealing with backlash over possible political leanings in the news feeds. On Friday the company announced it is reducing the role of human editors even further, in favor of having algorithms select trending topics. It’s fascinating that tech companies, on the one hand, get to reduce concerns about subjective human choices by pointing to their machines and models but at the same time, people should remember that at some point, humans input some of the rules into many of these models.
In the News
“Is big data in big trouble?”, asks TechCrunch. The answer is that some data companies like Tableau are overhyped and now as they miss their earnings forecasts, some investors are disappointed. At the heart of this, I think, is an over-investment in Hadoop-backed technologies. Hadoop moved the needle a lot in data analysis, but even as it is becoming outmoded (by Spark and other platforms that work better on distributed computing) companies are still doubling down on Hadoop. I think the Hadoop train will come to a halt at some point.
On Amazon Kinesis: Analyzing streaming data is a crucial part of bringing machine learning to bear on real-world problems. Amazon has had a system called Kinesis for a while now, but they officially took the “Beta” label off of it this week. Amazon’s done a good job at servicing both developers (by allowing the them to use Kinesis infrastructure to build powerful applications) and also business analysts, by allowing users to query data streams using SQL in realtime. The ideas in Kinesis aren’t new, but Amazon’s implementations are rock-solid and they’ve done a good job integrating the service with all of the other infrastructure services that Amazon provides. A nice writeup here.
It’s hard competing with the biggest tech companies. So Rackspace, an early cloud-computing company that went public in 2008, has found. This week it went private again.
In Industry
I’ve been following self-driving cars with interest in this newsletter because I think it’s one of the most visible ways we’re seeing artificial intelligence and data models turn into products that will be right in front of normal consumers. So, I wanted to note that the the world’s first network of self-driving taxis began this past week in Singapore. How this network fares will be held up as an example in many driverless car debates, I’m sure.
You all have experienced the clogged-up Internet, where downloads take forever. One driver of the problem is all the images and streaming movies we are watching. Cool to see how Google is looking to artificial intelligence to work on better image compression.
This is a great series of charts that shows you which companies and which industries are investing the most in artificial intelligence research and patents and which types of AI are most commonly being pursued. Fujitsu? Who knew.
In Research
A cool paper on using data on two effects to figure out whether A causes B or B causes A just from the data.. Normally this is hard to do because you have to actually run experiments to see if A is really causing B or just correlated with it. This paper contains some new techniques for inferring it from the data itself by seeing how noise in A affects noise in B.
The professor, José Daniel García, at the University of Madrid, is working on some cool stuff: his REPARA project is working to automatically rewrite programs so that they can be run on multiple graphics cards simultaneously. This has been a consistent interest of mine: how can we build systems that take software that’s already written, figure out how the programs work, and then automatically rewrite them so that they run much faster? I think of it as AI for computer programming itself.
I’m finding myself increasingly interested in statistical natural language processing, where computers try to understand written text by processing huge volumes of data (like news articles), but without any prior knowledge about language or grammar. So, I was excited to see that the Google Brain team released model code for their cutting edge news article summarizer. The models are constructed in TensorFlow, Google’s open-source machine learning framework. It’s great to see so much great AI research being done out in the open!
I really liked this technical blog on optimization techniques. In particular I loved the following graphics by Alec Radford showing how different methods of optimization interact with different kinds of functions:
Animations that may help your intuitions about the learning process dynamics. Top: Contours of a loss surface and time evolution of different optimization algorithms. Notice the “overshooting” behavior of momentum-based methods, which make the optimization look like a ball rolling down the hill. Bottom: A visualization of a saddle point in the optimization landscape, where the curvature along different dimension has different signs (one dimension curves up and another down). Notice that SGD has a very hard time breaking symmetry and gets stuck on the top. Conversely, algorithms such as RMSprop will see very low gradients in the saddle direction. Due to the denominator term in the RMSprop update, this will increase the effective learning rate along this direction, helping RMSProp proceed. Images credit: Alec Radford.
Quirky Corner
Dumbing down data – One of the risks of bubbles in certain parts of our economy is that you get a bunch of people working in those areas who become “experts” but, in fact, they don’t know what they are doing really and would be quickly exposed as charlatans if there were less money floating around that area. There’s a degree to which I think this has happened in the data space. How many “data scientists” are there now who wouldn’t have passed an advanced math degree program. This book by Cathy O’Neil, a former math professor at Barnard, exposes lots of the shoddy non-mathematics based thinking that gets used by data scientists catering to businesses and makes an argument that the mainstreaming of data leads to bad results for society, including more inequality. Worthwhile read.
Keep some skepticism when you hear businesses pitching you on fancy new types of things you are doing with fancy new labels. Om Malik, the tech writer and founder of GigaOm, had a good essay in The New Yorker this week about how all these new terms – “artificial intelligence,” for instance — are just a continuation of other things we’ve long been doing.
Biking, not golf — I often marvel at how many fewer of my peers golf than in my parents’ generation. So check out this article, which says that cycling is the new golfing for the tech industry. Totally prefer two hours on my bike than time on a golf cart.
What’s happening at Ufora
My colleague Ronen Hilewicz gave a talk at the Women in Machine Learning and Data Science meetup in New York about scaling up machine learning algorithms. His main point? You shouldn’t have to rewrite your program to get it to work with huge datasets. You can watch his talk here. (Password is 5LjHhe6N)
We are up to our necks in consulting work so I am changing this newsletter to become a monthly update. That means I’ll bring you the very best stuff I see at the end of the month. I’m excited to correspond with any of you individually anytime.

Braxton McKee is the technical lead and founder of Ufora, a software company that has built an adaptively distributed, implicitly parallel runtime. Before founding Ufora with backing from Two Sigma Ventures and others, Braxton led the ten-person MBS/ABS Credit Modeling team at Ellington Management Group, a multi-billion dollar mortgage hedge fund. He holds a BS (Mathematics), MS (Mathematics), and M.B.A. from Yale University.
This Week in Data by Braxton Mckee (CEO, Ufora) & MLconf Alumni Speaker, Issue #8
Kick Off:
A major enterprise software company CEO said this in 2008: “The interesting thing about cloud computing is that we’ve redefined cloud computing to include everything that we already do. I can’t think of anything that isn’t cloud computing with all of these announcements. The computer industry is the only industry that is more fashion-driven than women’s fashion. Maybe I’m an idiot, but I have no idea what anyone is talking about. What is it? It’s complete gibberish. It’s insane. When is this idiocy going to stop?”
That was Larry Ellison, CEO of Oracle, in 2008. Fast-forward eight years and Oracle bought NetSuite this week, a company that has cloud computing throughout its DNA. This signals the way cloud-computing is remaking enterprises top to bottom.
Of course, these days it’s not just about putting data in the cloud, it’s about using it in a smart way once it’s there. Even sophisticated companies can take a while to really understand how to use the cloud (apparently it took Oracle years!). I see a lot of companies letting their in-house infrastructure team lead the effort to move to the cloud. This doesn’t produce the best results, however, because the cloud is fundamentally different than that super-expensive datacenter you’ve been paying for: it’s agile and self-service. The whole point is to let your data-scientists and analysts get access to computing power as soon as they need it. So if you’re moving to the cloud, I strongly suggest empowering your data scientists to run their own access to it. I’ve seen several companies through this and happy to talk you through it if your firm is making the leap.
In the News:
You hear a lot about people jurisdiction-hunting for tax havens and places that will let them set up secretive shell companies. Well the same thing is happening in a way with data storage. Companies like Microsoft have been in court arguing that information they are storing is out of reach of the U.S. government, based on where it is stored. Microsoft recently convinced a US court that data it has stored in Ireland is out of U.S. jurisdiction. Whether this ruling is good or bad for privacy remains a hot debate in the industry, with a prominent privacy advocate saying this week that the ruling creates data borders that could be bad.
—
The data integration company Talend IPO’d this week. There are other publicly-traded data companies, like Teradata. This shows the maturation of this part of the tech industry out of strictly start-up form. Teradata also made news with an acquisition of a UK data company.
In Industry:
For years, people in finance have been buzzing about the possibility of using data from around the web for a sort of sentiment analysis that will lead to good stock picks. One company, Kavout, is now merging that sort of information with traditional fundamental datapoints in an algorithm it says leads to better outputs.
Interestingly, Kavout says it’s starting to use “deep learning” to find new trading strategies. I hear this idea coming up more and more, and I’m curious to see how it plays out. I’ll admit I’m a little skeptical – deep learning has made huge strides in voice and image recognition, but the technique requires a huge amount of data to be made to work. As one researcher argues here, if we look at how much data is used in other successful uses of deep learning and translated that into stocks, it would be the equivalent of hundreds of thousands of years of data (which we obviously don’t have).
—
Amazon keeps knocking it out of the park on its earnings, and a lot of the reason is its cloud-computing platform, where scores of companies like mine store their data. But the Amazon’s Prime program is also adding substantially to its earnings and the FT said this week that its use of customer data in Prime is a big part of its success.
Quirky Corner:
Most people try to be fairly open-minded in tech, but still there are some taboo questions. Like sex robots. MIT Technology Review has a full list.
—
Apple announced on Wednesday that it has sold 1 billion iPhones. How does that compare to the number of Playstations, Harry Potter books and “Thriller” albums sold? Interesting compilation of best sellers across a variety of categories here.
—
Ray Kurzweil, my favorite font of crazy futurist predictions, gave a keynote speech at a Seattle mobile technology conference where he argued that we are currently in by far the best time in human history. His point: we have unprecedented access to data about what’s going on in the world than we ever have before. As our access to information about bad events increases, our perception is that things are getting worse, even though things are actually improving. Personally, I think it’s the job of the data industry to help us move beyond sensationalism and really understand what the mass of data is telling us.
Braxton McKee is the technical lead and founder of Ufora, a software company that has built an adaptively distributed, implicitly parallel runtime. Before founding Ufora with backing from Two Sigma Ventures and others, Braxton led the ten-person MBS/ABS Credit Modeling team at Ellington Management Group, a multi-billion dollar mortgage hedge fund. He holds a BS (Mathematics), MS (Mathematics), and M.B.A. from Yale University.
This Week in Data by Braxton Mckee (CEO, Ufora) & MLconf Alumni Speaker, Issue #7
Kick Off:
“Overcomplicated.” Do you ever feel that way about our increasingly tech-driven world? That’s the name of a new book I read this week by a complexity scientist named Samuel Arbesman. It’s a good read, accessible to anyone. Beyond giving good explanations of basic programming concepts like recursion (when code refers to itself), it walks through scores of past examples of when models broke down and man couldn’t understand why.
The reason many of our systems have become too complicated for any human to understand is that their creators fidget with them until they work but don’t quite understand why it worked in the end. I can’t think of a better example of this than the new algorithms underpinning the AI resurgence: deep learning. These new systems are grown and trained – they aren’t designed. So they can have really unexpected behaviors outside of the ones they are intended for. I don’t think we should be overly alarmist about all this, but it’s important to understand this as we plow forward with advancements in this area.
In the News:
Workday acquired the big data company Platfora, which built a data analytics platform on top of Hadoop. These sorts of acquisitions show that an entire mini-economy has been built around Hadoop, an open-source storage and processing platform for large data sets. I would caution people from getting more wrapped up in Hadoop because of more advanced open-source systems, like Spark, that have come along. This tends to happen with industry and computing — as soon as industry figures out a big change and adapts, the developers are onto something much better.
There is so much data out there now that researchers are constantly trying to combine data sets to look for causal effects. But that can’t always accurately be done. Some computer scientists at UCLA and Purdue have developed a mathematical tool called a structural causal model, which figures out how information from one source can be combined with data from another source. As they explained, it’s “like putting together a jigsaw puzzle using pieces that were produced by different manufacturers.” Technical write up here. Layman write up here. Cool stuff.
More new hardware out from Nvidia. The chip maker continues to make investments in new GPUs. It’s well known that that GPUs, or graphics processors, have been a primary catalyst of the resurgence in AI. But I was surprised to hear that Nvidia announced this GPU at an AI meetup, and the new chip has specific instructions designed for deep learning. It’s a sign that AI may come to dominate graphics processing units’ future more than its early driver, video gaming. At what point do we start calling it an AIPU?
Autopilot saved a pedestrian life in DC this week. People can worry all they want about self-driving cars, but there is technology coming out of the push to self-driving cars that will benefit society, even if we keep drivers behind the wheel.
In Industry:
It is super prestigious to become a doctor, but apparently many doctors now spend several hours a day entering data about their patients. Interesting how bringing technology into a field can reshape jobs and may sometimes mean that new data-clerk jobs need to be created.
So Spotify is now offering advertisers targeted ads, using the data about your listening patterns. But I’m not sure how someone buying a 15-second audio ad spot would figure out whether someone who listens to smooth jazz is more desirable than someone who, say, listens to heavy metal.
Data centers are known to be big energy wasters. So it’s cool to see Google testing AI systems to improve the energy efficiency of its data centers. There’s something very meta here: the data centers are where AI gets trained and now AI can help them be more energy efficient, all the while creating more data to store.
Quirky Corner:
Not sure if any of you are playing Pokemon, but beyond its goofy fun is some seriously advanced use of mapping technology. Here’s a good Bloomberg story on the start-up behind that.
Love this video of Facebook’s solar powered, Internet-beaming plane.
Last, if you’re spending time at the beach this summer and you want to know what’s across the ocean from you, take a look at these maps. It’s not always what you think.
Braxton McKee is the technical lead and founder of Ufora, a software company that has built an adaptively distributed, implicitly parallel runtime. Before founding Ufora with backing from Two Sigma Ventures and others, Braxton led the ten-person MBS/ABS Credit Modeling team at Ellington Management Group, a multi-billion dollar mortgage hedge fund. He holds a BS (Mathematics), MS (Mathematics), and M.B.A. from Yale University.